18 Apr New map shows warming waters where coral reefs could be under threat
The ocean is increasingly becoming too hot to handle. And coral reefs are suffering as a result.
Above-normal sea surface temperatures due to human-induced climate change are creating conditions that are stressing coral reefs, causing them to bleach, a phenomenon by which heat-stressed corals are forced to expel their symbiotic algae that provide them with nutrition, leaving them weak and ghostly white. If the heat stress persists for too long, reefs may never recover, and even die.
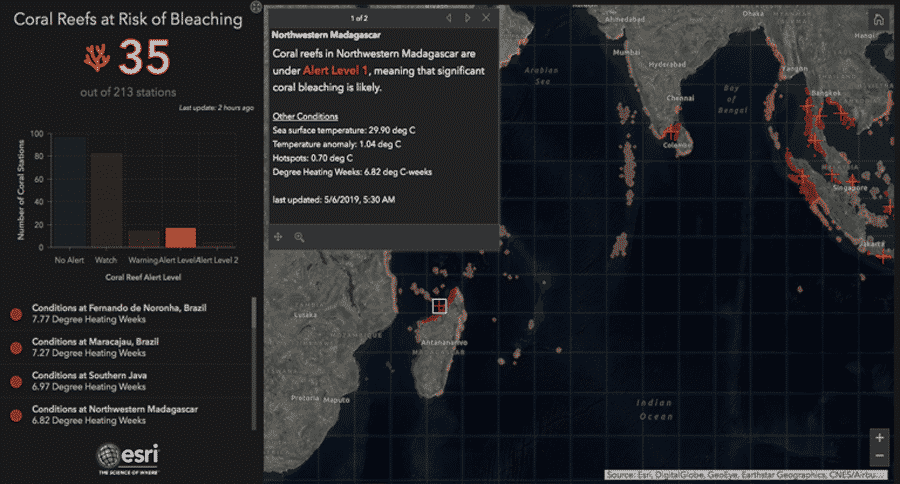
A new interactive map can help you identify, in near-real-time, where the sea is warming up at alarming levels, putting coral reef at risk of bleaching.
The Coral Reefs at Risk of Bleaching Operations Dashboard, launched by Esri, a company that creates geographic information system (GIS) and mapping software products, relies on data from the U.S. National Oceanic and Atmospheric Administration’s (NOAA) Coral Reef Watch program, a decades-old program that uses satellites to measure average daily sea surface temperatures and predict bleaching-level heat stress.
While the satellite data itself isn’t new, the way the data is displayed is novel and more user-friendly, said Dan Pisut, who leads Esri’s Living Atlas of the World Environment, a collection of environment-related geographic information.
“It’s just explaining a concept in a different way,” Pisut said. “We’re not doing anything to the data that changes what it’s saying. We’re only saying how can we display it in a different way that might be more meaningful to somebody.” While the NOAA Coral Reef Watch program typically works with experts, such as reef managers and researchers working on solutions to coral bleaching, the Esri map is meant for the general public, Pisut said. “We were looking at developing a dashboard that was a little bit more understandable to the general public, to bring up people’s understanding that this [warming and bleaching] is happening and they can track how it’s happening over time and where these different things are happening,” Pisut said. “You can see a bleaching event emerge real-time.”
Before joining Esri, Pisut worked at NOAA for two decades, so he was familiar with the organization’s data sets. “It is also a very reliable data source, which is also something we at Esri’s Living Atlas of the World look at — how we can partner with other groups to get data into the living atlas and maybe develop some additional way of displaying it or analyzing it.”

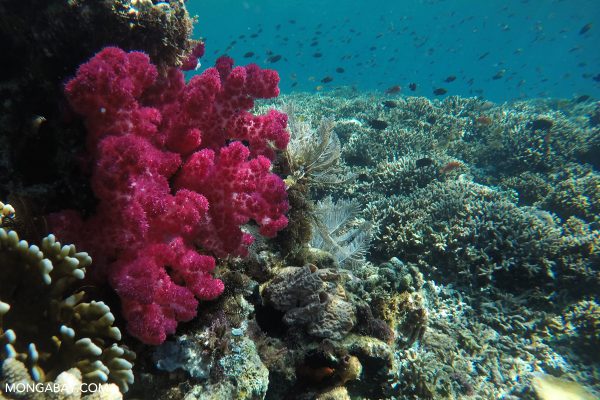
Corals in Indonesia. Image by Rhett A. Butler/Mongabay.
NOAA’s Coral Reef Watch Program uses its network of satellites to monitor sea surface temperatures at a resolution of 5 kilometers (3 miles), or over blocks that are each 5 kilometers long and wide. It then uses these measurements to derive a range of ocean warming-related information across 213 regions that it calls “regional virtual stations.” Since corals are very sensitive to temperature changes and can bleach once temperatures go beyond their normal tolerance limits, NOAA uses its measurements to predict regions where coral reefs might be under heat stress and could experience bleaching.
The Esri map distills NOAA’s data and displays regions that are facing both high heat stress, increasing the risk of coral bleaching, such as those under Alert 1 and Alert 2 categories, as well as areas where the likelihood of coral bleaching is low or none at the moment, such as those under “Warning” and “Watch.”
“In developing the display of this map what we wanted to do was to draw attention to the areas of importance, and those are the areas that are experiencing Alert Level 1 and Alert Level 2,” Pisut said. “But we still provide all the information that’s contained within the virtual stations data. The idea is that you might identify an area of interest and then zoom into it and then you’ll see the individual coral reef virtual stations and then get all the information that’s contained in them.” 
The map presents near-real-time data. “The data updates every day from NOAA and we’re constantly checking their servers and we’re refreshing our systems every 5 to 10 minutes just in case something changes there,” Pisut said.
The map would be especially useful as a starting point for people wanting to know more about our warming oceans and what it could mean for coral reefs, Pisut said. Besides the display itself, Esri has made the data available for analysis in the Living Atlas of the World. “The Dashboard is also one of the many application templates that Esri provides in its ArcGIS platform. They’re really easy to build and customize, and are used by a wide variety of industries and organizations,” he said.
To build the tool, Pisut’s team consulted NOAA’s Coral Reef Watch Program team at various stages. The NOAA team helped them understand the data files, and gave them context to how the data was to be interpreted. “They defined reefs at risk as being in the warning Alert Levels 1 and 2, which was different than I would have thought,” Pisut said. “I would have thought a Watch would be a reef at risk. So having important context from them about how they describe their data was also important.”
Mark Eakin, a coral reef specialist and coordinator of NOAA’s Coral Reef Watch program, told Mongabay that Esri’s dashboard does a “nice job of pulling together data to make them highly useable.”
“By including Coral Reef Watch’s products to the array of environmental data they are highlighting, it provides a new way for us to reach out to users who might not normally be looking for coral reef data,” Eakin said. “This alerts new users to the problem coral reefs already face. If would be nice if they not only highlighted the current product but also the data from future warming scenarios. These would alert people to the problem we face very soon.”
In fact, getting information on ocean warming and coral bleaching out to more people is critical. This is because climate change, worsened by humans continuing to burn fossil fuels, has become the biggest threat to coral reefs around the world, Eakin said. “Climate change is already causing dramatic harm to the most diverse marine ecosystem in the world by causing corals to bleach and die. This impacts hundreds of millions of people around the world. We need more people to wake up and realize we need to take action now.”
Source : https://news.mongabay.com/2019/05/new-map-shows-warming-waters-where-coral-reefs-could-be-under-threat/?fbclid=IwAR1F0HAaXWw8nCCpxHyPj8mlM2XINNHliMEIBYOeP_xQtA6KUpiBqlpU0Fc
