29 Sep Making Unseen Emissions Visible
Author: Richard Cooke
Thanks to the growing transparency of greenhouse gas emission data, today’s global consumer can know the approximate carbon footprint of nearly any activity, product, or location with a simple internet search.
A smartphone user can learn that a new device will generate 85 kilograms of emissions in its first year of use, due largely to production processes like raw-material mining and shipping. Thanks to online carbon emissions calculators, an HR director can determine that each biweekly flight an executive takes from San Francisco to New York creates 1.5 metric tons of carbon.
CO2 and other greenhouse gases are accelerating climate change, which in turn disrupts business continuity and everyday life. The growing public availability of carbon data has heightened the importance of context, and one new app uses geographic information system (GIS) technology to visualize carbon dioxide—otherwise undetectable by the human eye—in the context of location and time.
Through such technology, a company’s carbon footprint now may become visible to the public, a reality that could increase the business cost of not addressing excessive emissions.
Seeing the Unseen Carbon Emissions
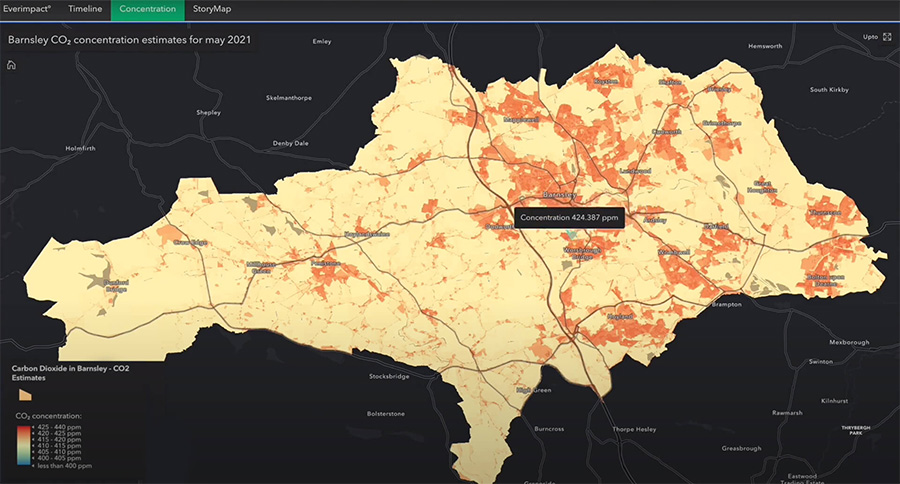
A team of geospatial data scientists and developers built the app, called Seeing the Unseen, as part of a climate-focused hackathon. The app uses GIS to create a dashboard showing NASA-measured carbon concentrations across a geographic region.
The app shows how these dynamics play out over the English town of Barnsley. The app’s creators envision that any municipality could eventually employ the same technology to monitor its own CO2 levels.
Location analysis enables users to zoom in on a particular neighborhood or highway system for a more granular view of the local carbon footprint. Dragging a slider over the GIS map makes it possible to view before and after pictures of how greenhouse gas emissions have increased or decreased over the years.
It’s an approach that blends geography with data science. Residents near a city’s industrial sector or workers at a corporate campus could use a smart map like this to gauge the quantities of carbon emissions block by block.
These map-based insights into spatial trends and patterns—known as location intelligence—could influence decisions by community stakeholders. Once they see greenhouse gas emissions in geographic context, local leaders might restrict development in certain areas or change land-use regulations to help meet carbon-reduction and net-zero goals.
When CO2 Data Becomes Public Knowledge
The Seeing the Unseen app could be useful to businesses as well, to assess air quality for workers at a warehouse or near a potential new office building. But the growing availability of spatial analytics technology also represents a possible business risk for organizations that aren’t monitoring their own greenhouse gases.
Regardless of whether business leaders voluntarily disclose such data (less than one-third of public companies do, according to one study), it could become public knowledge through the rise of remote sensing capabilities. A poor record on emissions could cause reputational harm or lead to increased scrutiny from regulators.
Indeed, a new field known as spatial finance has sprung up as lenders incorporate sustainability measures into investment calculations. By using a combination of technologies including GIS, satellite imagery, and artificial intelligence, a bank can learn more about a company’s contributions to CO2 than the company’s own C-suite knows. A business that neglects to monitor or mitigate emissions through measures like clean energy may be considered an investment risk.
Knowledge is power, as the saying goes, and technologies like GIS are leading to a wave of data transparency. Smart companies are using that data to their advantage by getting ahead of business risks, rather than being caught unawares.
Unleashing GIS Technology’s potential in every industries
